
Notebook example
Bench Data Comparison
Inspect an older comparison of Python and GNU Radio recordings.
Read the explanations, code, and available results below. Code does not run on this page.
Andrew Dyck developed these research examples in 2019. Project setup and documentation were provided by Pranav Sanghavi.
This bench notebook references unavailable local recordings and older SciPy APIs. It cannot currently run as supplied.
The preview includes the original saved results. These results have not been reproduced with the missing recordings.
Run this notebook yourself
Use Python 3, Jupyter, NumPy, SciPy, and Matplotlib. Review older APIs and local file paths before running.
Download the notebook and open it in Jupyter. Review its code and data requirements before running the cells.
Saved outputs are shown below.
%matplotlib notebook
import struct
import numpy
from matplotlib.pyplot import *
import scipy
f = scipy.fromfile(open("/home/andy/python_file"), dtype=scipy.float32)
g = scipy.fromfile(open("/home/andy/gnuradio_file"),dtype=scipy.float32)
f.shape[0]-g.shape[0]
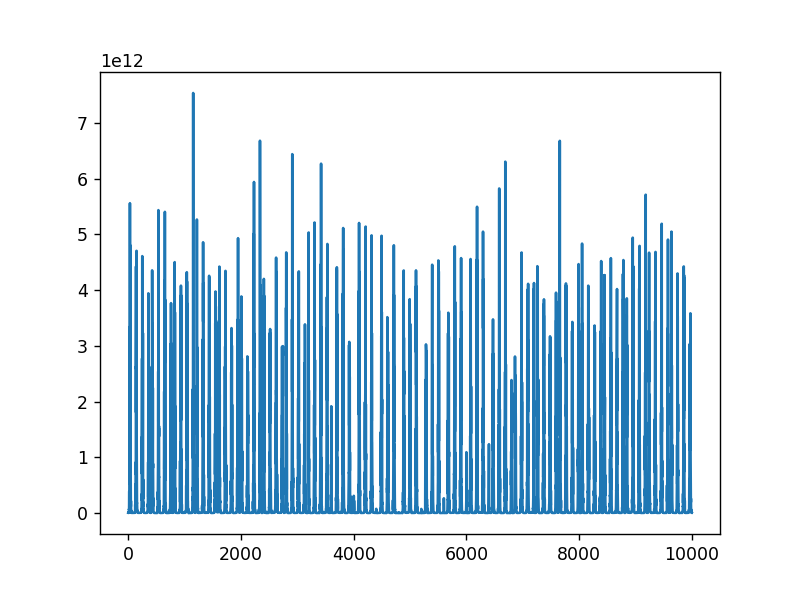
plot(f[0:10000])
figure()
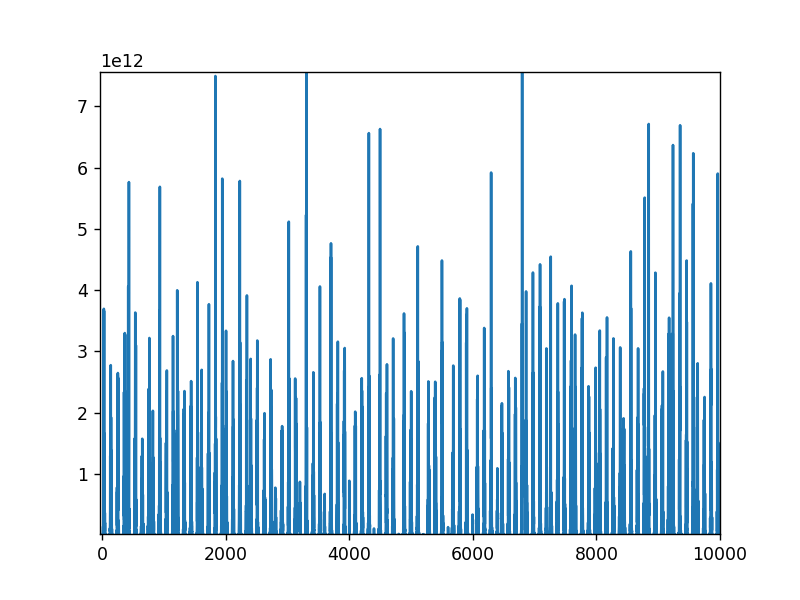
plot(np.flip(g[0:100000],0))
np.where((g/1.25)==(g/1.25).max())
np.where((f)==(f).max())
6690-1153
1/.0002